DATA - By digging through the basic data of one million football (soccer) games, going back to 1901, you can distill some interesting trends. The average goals scored per game is 2,77. But there’s a lot more to it.
Courtesy of the people of Footballfans.eu, a groundhopping community, I was able to analyse the outcomes of a million football games. The oldest games are from the English First Division in 1901. The database now contains competitions and cups from over 75 countries and most international championships. It’s a wealth of data, that shows for instance that the home game advantage has been declining over time. Or that players in the northern hemisphere score more goals during the summer, but players in the southern hemisphere do not. And that Morocco is the country where the least goals are scored on average.
But first, let’s look at the distributions of the scores from all the games in the data set. As you can see, 1-1 is the most common score, 11 percent of the games end that way after regular playing time.

In the section “other scores”, we find some pretty exotic results. How about 0-31 in the game between Snæfell and Haukar in Iceland? Or 24-0 in a game in Estonia between Levadia and FC Soccernet? Also worth mentioning are two very old friendly games. In 1908 Denmark defeated France with 17 to 1! More recently in 2011 San Rafael lost to Atlético Madrid with 1 to 19.
Now let’s have a more narrow look. We only take the top two divisions of each country, only the normal competitions and we start in 2000.
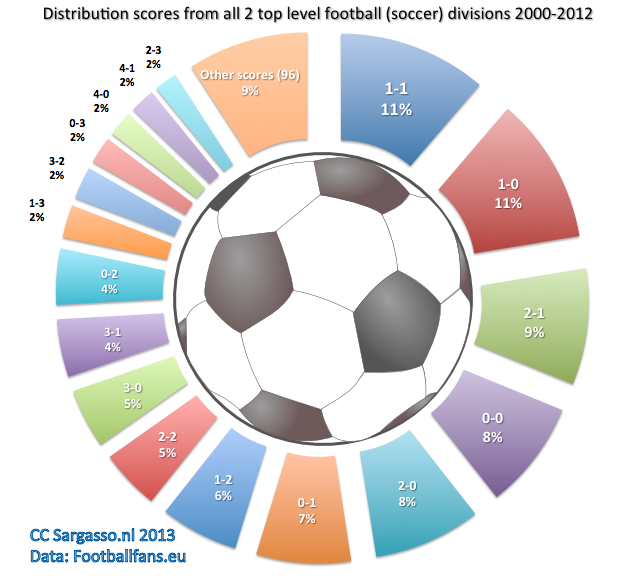
The graph looks quite similar to the previous one. There seems to be some consistency to it, so use this wisdom for your future bets!
Trends
Now let’s look at trends. This time we take all the national competitions (not cups), starting in 1901 (watch the gaps for the wars). And for each year we take the average number of goals scored in a game that year.
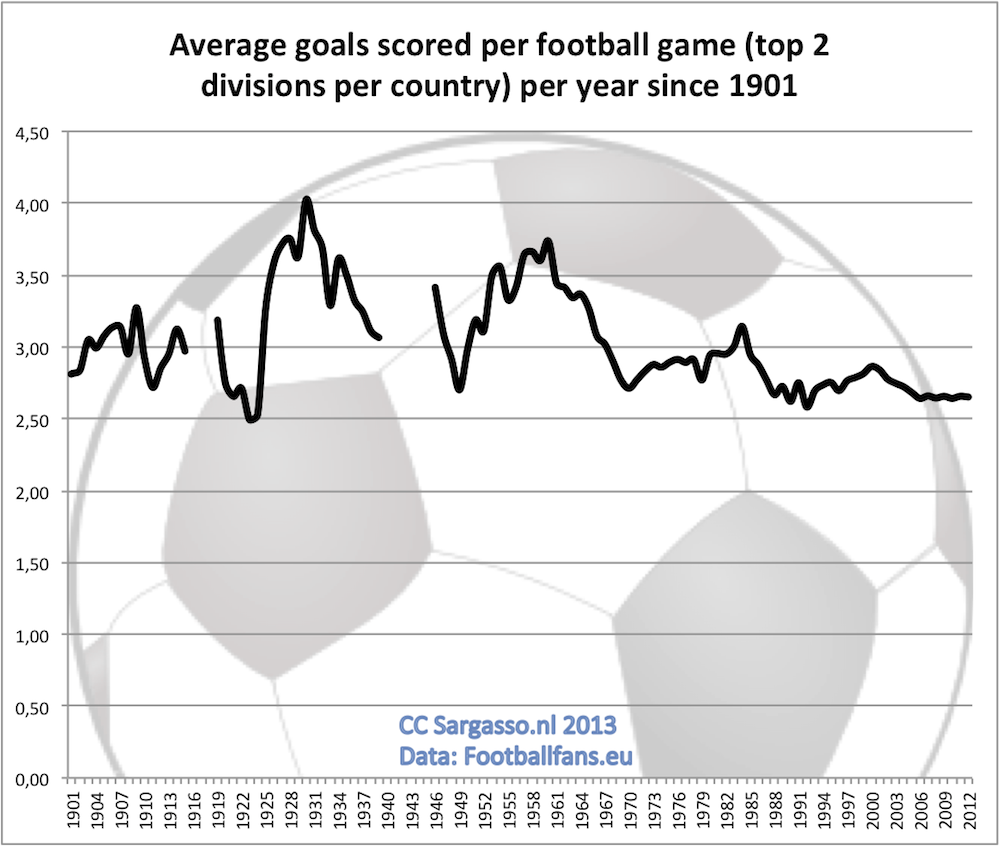
There are lots of fluctuations in the first half before it starts to stabilize and show a slight downward trend. Maybe because the goal keepers keep growing.
We now zoom in to the period starting 1946 and break it down to the home and away goals as well:

Now that looks interesting. It looks like the home advantage is declining. We can visualize this better by only showing the difference between the average number of goals scored by the home team and the away team.
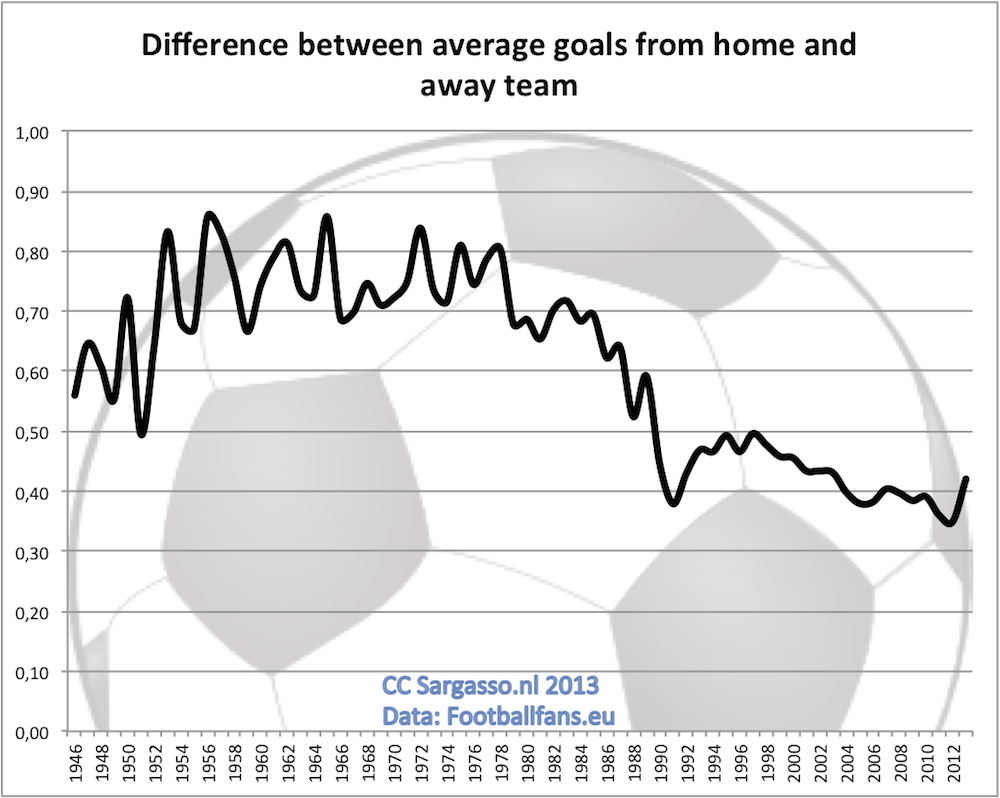
Clearly a downward trend for the home advantage in the last thirty years. Bring in the talking heads!
Brazil becoming less attractive?
Let’s zoom in again. Only the top two divisions for each country and a shorter period.
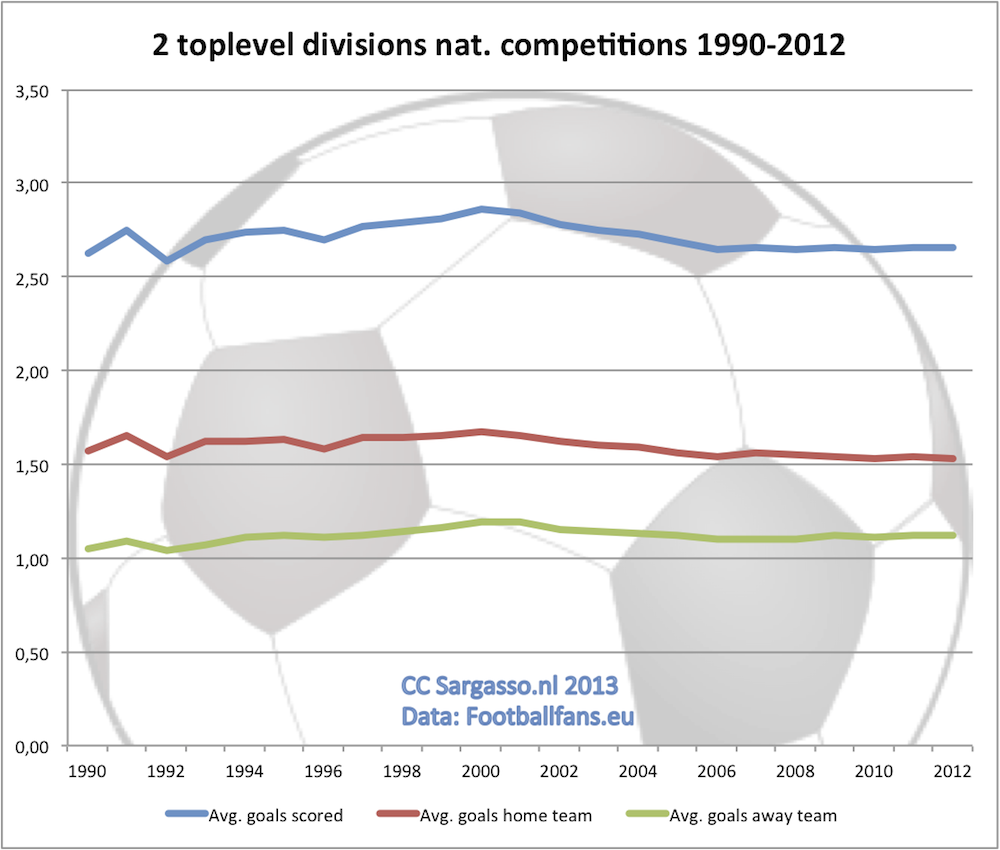
Boring. We have to try something else. Let’s use all national competitions again, but this time split them across the globe. So how does the North compare to the South?

That’s better! There seems to be a trend there. Are the Brazilians losing their reputation for attractive football? Are the Argentines no longer so eager? What’s up?
Okay, now let’s compare national competitions to international competitions (world cups, EUFA cups, etc…)
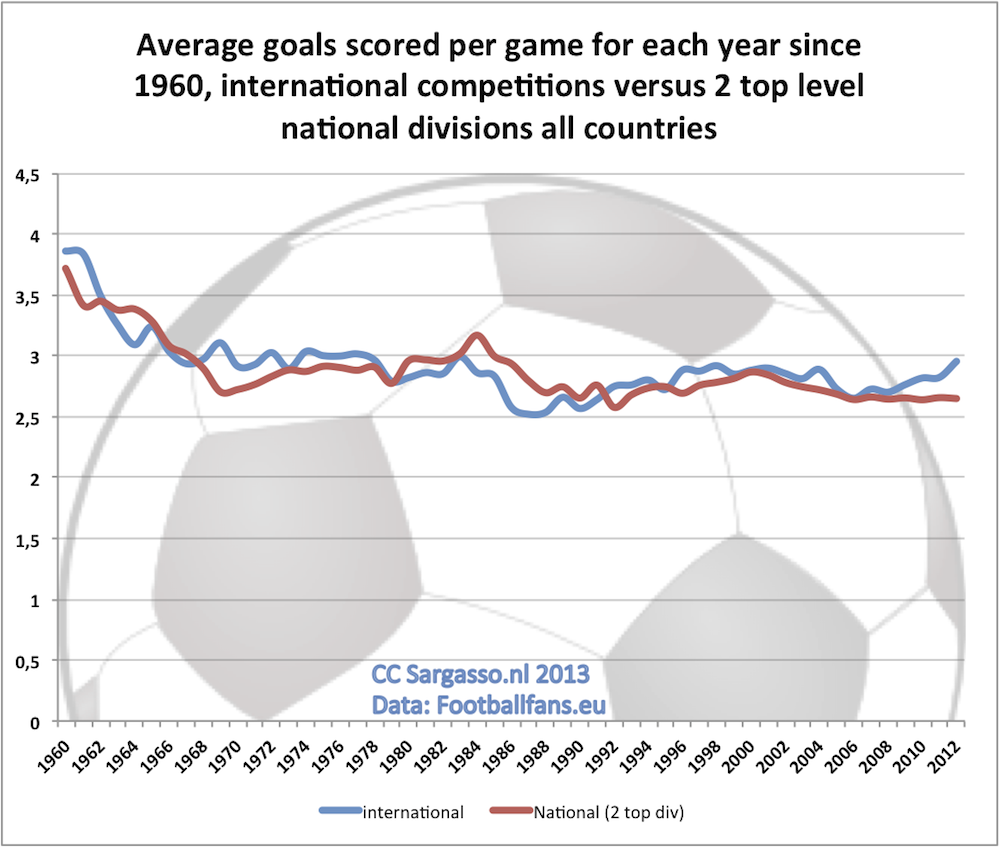
They seem to be in step, although one might think the international competitions trend is two years delayed from the national one. Curious.
More goals in summertime
Let’s take a completely different angle. Do the seasons have any influence on the scoring? For this we have to split up between north and south again, of course.
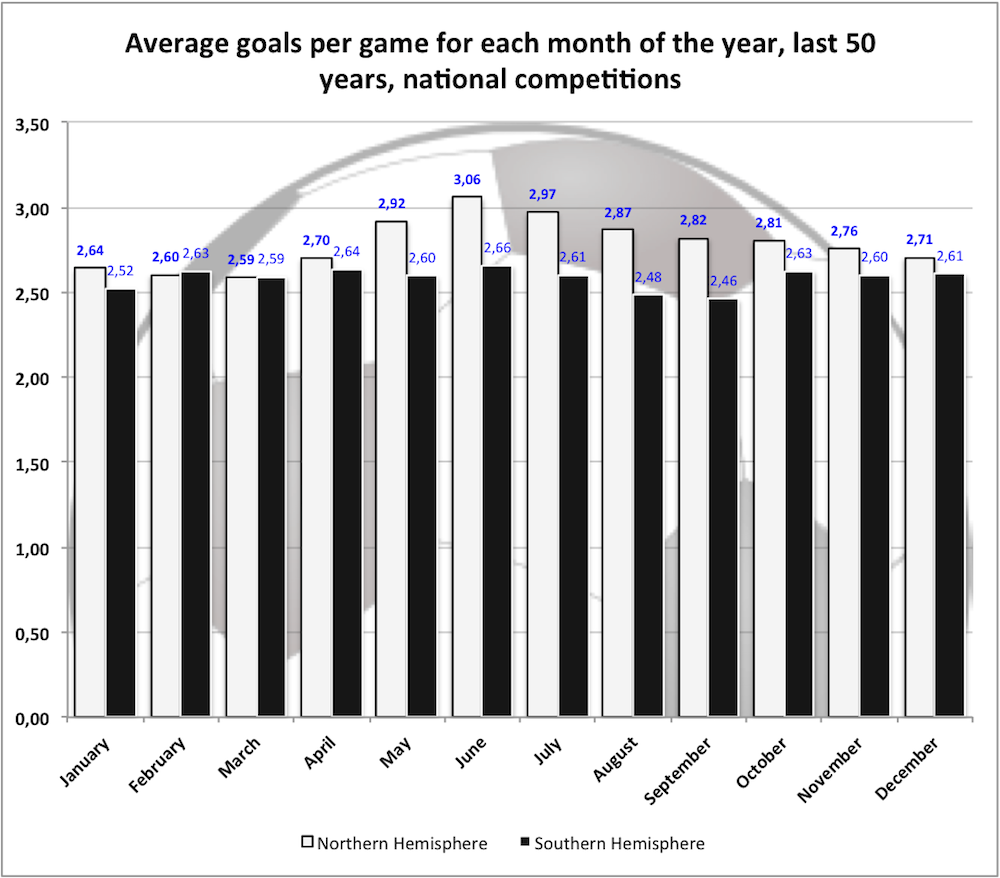
Yes, the summertime in the north makes players score more often. Odd thing is, not in the south. What could explain this phenomenon?
Day of the week
The last viewpoint uses the day of the week. More goals on Sunday or on Monday?
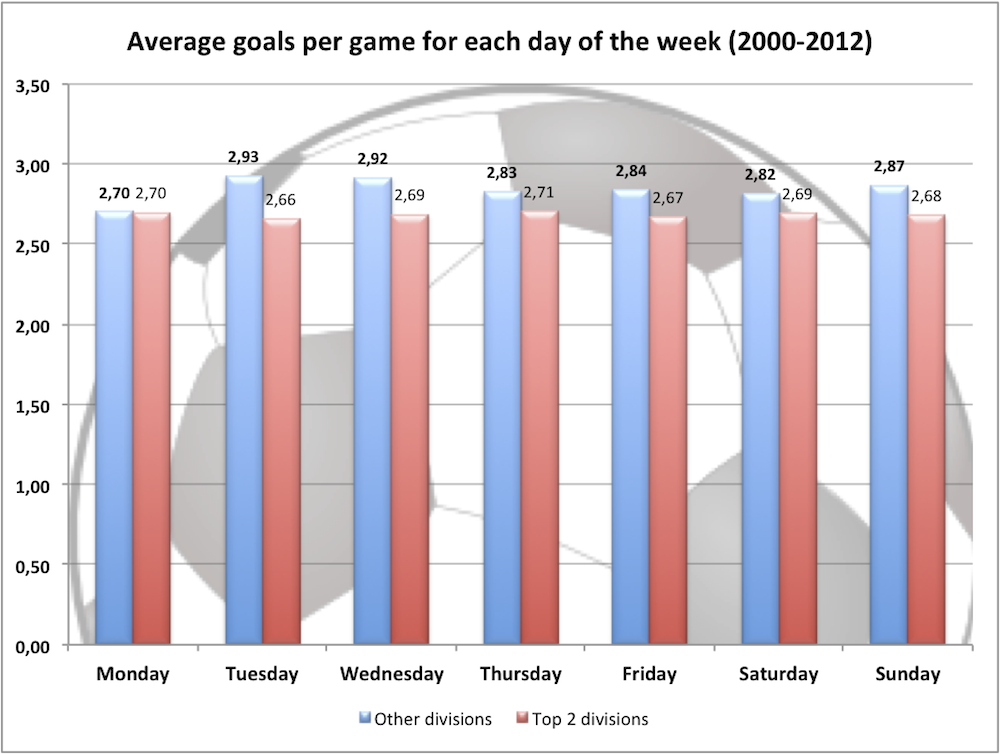
The two top level divisions seem to play very consistent over the week. But below that, Sunday is the worst time to go and watch a game if you want the most bang for your bucks.
Liechtenstein most goals, Morocco the least
The table below shows the average score per game, per country. Best country first (so you have to search your country maybe). All national competitions are used.
| Country | All | Top 2 div. | Lower div. |
| LIECHTENSTEIN | 4,85 | 4,85 | |
| ANDORRA | 3,96 | 3,92 | 4,44 |
| ESTONIA | 3,64 | 3,55 | 4,70 |
| CANADA | 3,52 | 3,55 | 1,83 |
| LATVIA | 3,49 | 3,42 | 4,09 |
| NORWAY | 3,44 | 3,22 | 3,79 |
| FAROE ISLANDS | 3,36 | 3,36 | 3,35 |
| LUXEMBOURG | 3,32 | 3,27 | 3,75 |
| WALES | 3,32 | 3,29 | 3,59 |
| DENMARK | 3,17 | 3,07 | 3,34 |
| SWITZERLAND | 3,15 | 2,96 | 3,45 |
| NETHERLANDS | 3,15 | 3,07 | 3,24 |
| MALTA | 3,15 | 3,18 | 3,05 |
| LITHUANIA | 3,10 | 3,08 | 3,39 |
| ICELAND | 3,09 | 3,05 | 3,48 |
| FINLAND | 3,07 | 2,76 | 3,34 |
| SWEDEN | 3,04 | 2,76 | 3,25 |
| SAN MARINO | 3,02 | 3,02 | |
| GERMANY | 3,01 | 2,97 | 3,04 |
| BOLIVIA, PLURINATIONAL STATE OF | 3,01 | 3,01 | |
| HUNGARY | 3,00 | 2,88 | 3,18 |
| AUSTRIA | 2,98 | 2,77 | 3,27 |
| NORTHERN IRELAND | 2,98 | 3,02 | 2,96 |
| BELGIUM | 2,97 | 2,85 | 3,00 |
| SLOVENIA | 2,95 | 2,80 | 3,35 |
| CYPRUS | 2,93 | 2,97 | 2,76 |
| ARMENIA | 2,89 | 2,92 | 2,56 |
| CHILE | 2,89 | 2,86 | 3,04 |
| UNITED STATES | 2,88 | 2,72 | 2,96 |
| ENGLAND | 2,87 | 2,88 | 2,87 |
| JAPAN | 2,83 | 2,83 | 2,00 |
| SCOTLAND | 2,82 | 2,66 | 2,93 |
| CROATIA | 2,81 | 2,73 | 2,98 |
| BRAZIL | 2,79 | 2,81 | 2,73 |
| URUGUAY | 2,76 | 2,76 | |
| CZECH REPUBLIC | 2,72 | 2,47 | 2,88 |
| SERBIA AND MONTENEGRO | 2,70 | 2,75 | 2,44 |
| MEXICO | 2,70 | 2,70 | 3,00 |
| MACEDONIA, THE FORMER YUGOSLAV REPUBLIC OF | 2,68 | 2,69 | 2,64 |
| AUSTRALIA | 2,66 | 2,66 | |
| VENEZUELA, BOLIVARIAN REPUBLIC OF | 2,65 | 2,66 | 2,52 |
| ROMANIA | 2,65 | 2,46 | 2,77 |
| BELARUS | 2,64 | 2,61 | 3,02 |
| GUATEMALA | 2,64 | 2,64 | |
| TURKEY | 2,63 | 2,74 | 2,52 |
| BULGARIA | 2,62 | 2,63 | 2,43 |
| MOLDOVA, REPUBLIC OF | 2,61 | 2,58 | 3,04 |
| ECUADOR | 2,60 | 2,60 | |
| SLOVAKIA | 2,60 | 2,51 | 2,76 |
| BOSNIA AND HERZEGOVINA | 2,58 | 2,58 | 2,54 |
| GEORGIA | 2,56 | 2,55 | 2,59 |
| POLAND | 2,56 | 2,47 | 2,59 |
| PERU | 2,56 | 2,55 | 2,60 |
| ISRAEL | 2,54 | 2,53 | 2,68 |
| ALBANIA | 2,54 | 2,49 | 2,93 |
| PARAGUAY | 2,53 | 2,53 | |
| PORTUGAL | 2,53 | 2,45 | 2,57 |
| IRELAND | 2,53 | 2,51 | 2,74 |
| SPAIN | 2,52 | 2,51 | 2,53 |
| KOREA, REPUBLIC OF | 2,50 | 2,50 | |
| CHINA | 2,47 | 2,47 | |
| COLOMBIA | 2,46 | 2,44 | 2,61 |
| KAZAKHSTAN | 2,44 | 2,38 | 3,05 |
| GREECE | 2,44 | 2,30 | 2,68 |
| FRANCE | 2,42 | 2,27 | 2,46 |
| UKRAINE | 2,41 | 2,43 | 2,35 |
| ITALY | 2,40 | 2,50 | 2,35 |
| RUSSIAN FEDERATION | 2,40 | 2,39 | 2,60 |
| ARGENTINA | 2,39 | 2,42 | 2,38 |
| SERBIA | 2,37 | 2,14 | 2,49 |
| AZERBAIJAN | 2,35 | 2,35 | 2,37 |
| SOUTH AFRICA | 2,31 | 2,31 | 2,67 |
| MONTENEGRO | 2,29 | 2,29 | 2,32 |
| MOROCCO | 1,78 | 1,78 | 1,99 |
Best stadium for scoring goals
The second table is about stadiums of course. Since the data comes from a groundhopping community, we need to state something about the grounds. In the list below we used the two top level divisions. For each country we calculated which stadium had the highest average score since 2000. This time is sorted by country.
| Stadium name | Country | Avg. goals/ game since 2000 |
| Centre Esportiu d’Alàs | ANDORRA | 4,46 |
| Cloverdale Athletic Park | CANADA | 4,40 |
| Spordikeskuse staadion | ESTONIA | 4,27 |
| Glantraeth FC Ground | WALES | 4,12 |
| Stade Jos Becker | LUXEMBOURG | 3,80 |
| Stadions Arkādija artificial | LATVIA | 3,79 |
| Idrettsparken Stadion | NORWAY | 3,73 |
| LŽŪU stadionas | LITHUANIA | 3,72 |
| Stadion Gurzelen | SWITZERLAND | 3,72 |
| Siirt Atatürk Stadyumu | TURKEY | 3,71 |
| Gillested Park | DENMARK | 3,71 |
| Selfossvöllur | ICELAND | 3,63 |
| Crystal Park | NORTHERN IRELAND | 3,63 |
| Nairi | ARMENIA | 3,60 |
| Estadio Santiago Bernabéu | SPAIN | 3,58 |
| Gundadalur | FAROE ISLANDS | 3,56 |
| Grosics Gyula Stadion | HUNGARY | 3,56 |
| Expo ’70 Commemorative Stadium | JAPAN | 3,54 |
| Amsterdam ArenA | NETHERLANDS | 3,53 |
| Estadio del Deportivo Capiata | PARAGUAY | 3,46 |
| Complexul Sportiv Izvoraş | MOLDOVA, REPUBLIC OF | 3,45 |
| Stade Constant Vanden Stock | BELGIUM | 3,43 |
| Stadion Skalna Klet | SLOVENIA | 3,42 |
| Estadio Victor Agustín Ugarte | BOLIVIA, PLURINATIONAL STATE OF | 3,39 |
| Grenzland Stadion | AUSTRIA | 3,39 |
| Hibernians Stadium | MALTA | 3,39 |
| Weserstadion | GERMANY | 3,37 |
| Arsenal Stadium | ENGLAND | 3,34 |
| Estadio Salvador de la Plaza | VENEZUELA, BOLIVARIAN REPUBLIC OF | 3,34 |
| Arosvallen | SWEDEN | 3,31 |
| Campo Sportivo di Chiesanuova | SAN MARINO | 3,31 |
| Parque Federico Omar Saroldi | URUGUAY | 3,30 |
| Recreation Park, Alloa | SCOTLAND | 3,30 |
| Estadio Monumental David Arellano | CHILE | 3,30 |
| Milano Arena | MACEDONIA, THE FORMER YUGOSLAV REPUBLIC OF | 3,27 |
| Stadioni Evgrapi Shevardnadze | GEORGIA | 3,27 |
| Şəfa stadionu 4-cü meydança | AZERBAIJAN | 3,26 |
| Estádio Leônidas Sodré de Castro (Leônidas Castro) | BRAZIL | 3,25 |
| Paphiako Athlítiko Kentro | CYPRUS | 3,25 |
| Lockhart Stadium | UNITED STATES | 3,24 |
| Sichuan University Stadium | CHINA | 3,18 |
| Marco Antonio Fión Castellanos | GUATEMALA | 3,18 |
| Gradski Stadion kraj Sajmišta | CROATIA | 3,18 |
| Stadion Georgi Asparuhov | BULGARIA | 3,17 |
| Estádio das Antas | PORTUGAL | 3,17 |
| Estadio León (Nou Camp) | MEXICO | 3,13 |
| Stadion Bjelave | BOSNIA AND HERZEGOVINA | 3,13 |
| Stadion Pod Goricom | MONTENEGRO | 3,11 |
| Mosedal | FINLAND | 3,11 |
| Malaja Sportivnaja Arena | RUSSIAN FEDERATION | 3,10 |
| Estadio General Rumiñahui del Valle de Los Chillos | ECUADOR | 3,07 |
| Stadion GOS | POLAND | 3,07 |
| Stadyen Junatsva | BELARUS | 3,03 |
| Estadio Eduardo Gallardón | ARGENTINA | 2,98 |
| Štadión Pod Dubňom | SLOVAKIA | 2,98 |
| Fusha Sportive Adriatik | ALBANIA | 2,97 |
| Letní Stadion | CZECH REPUBLIC | 2,96 |
| Stadion Fiolent | UKRAINE | 2,93 |
| Estadio Metropolitano Roberto Mel?ndez | COLOMBIA | 2,92 |
| Jeonju World Cup Stadium | KOREA, REPUBLIC OF | 2,91 |
| Stadion Crvena Zvezda | SERBIA | 2,91 |
| Stadio Giuseppe Meazza | ITALY | 2,90 |
| Ferrycarrig Park | IRELAND | 2,90 |
| Parc Des Sports | FRANCE | 2,90 |
| Stadionul Voinţa | ROMANIA | 2,87 |
| Stadio Georgios Karaiskáki | GREECE | 2,83 |
| Ortalıq Stadion | KAZAKHSTAN | 2,83 |
| Westpac Stadium | AUSTRALIA | 2,82 |
| Estadio Jorge Basadre | PERU | 2,81 |
| National Stadium Ramat Gan | ISRAEL | 2,74 |
| Chatsworth Stadium | SOUTH AFRICA | 2,54 |
| Stade Mohamed V | MOROCCO | 2,05 |
If you have any interesting suggestions for doing more with the available data, please let us know in the comments. In the meantime, have a look at the source for some inspiration. This post wouldn’t have happened without them.
NB: Dutch/European decimal notation is used. So where you see 2,77 the Brits and Americans should translate this to 2.77
NB2: This article is published under a Creative Commons license. Feel free to copy and just add credits linking to this version.
Reacties (25)
The explanation of the flunctuation of average goals per match should be found in the development of tactics over the years. With Jonathan Wilson’s Inverting The Pyramid in hand you might find some interesting stuff. Because there are fewer real tactical revolutions in recent decades, the trend seems to even out.
This would also explain the delay in the trend of international football compared to national football. I recall zonalmarking.net claiming that club football tactics are generally more advanced. This make sense because in a national league there’s more time to develop your own tactics and to get to know those of your opponents.
The difference between the months of the year should be easily explained by the fact that leagues don’t take place during the entire year. The only club football that is played during the summer months is played in cold climates (Scandinavia, Russia). Apparently it’s these countries that skew the average.
We can visualize this better by only showing the difference between the average number of goals scored by the home team and the away team… Clearly a downward trend for the home advantage in the last thirty years.
Why did you use the difference? Considering the number of goals went down over time, the absolute gap was bound to be smaller. But how about the relative scores? Maybe it would be better to take a look at the ratio home:away goals. If that went down over time as well, than we could conclude the home advantage has been declining.
@2: Good one! I’ll have a shot at that tonight.
@2,3 still I’ld like to know the number of draws over time.
@4: The number or the percentage draws of all games played? And do you want it per year or just the total?
Is het nog te achterhalen hoe de scores verliepen, of de ‘run of play’ om specifieker te zijn?
Hoe vaak mondde een aanvankelijke voorsprong uit in een uiteindelijk(e) winst, gelijkspel of verlies etc.?
@4,
Voor praktische doeleinden: dat verschilt enorm per competitie, seizoen en team. Zie bijvoorbeeld de stats voor het lopende seizoen.
P.S. Waarom fluisteren we? Spreken we Engels bedoel ik.
Interesting to know the Faroes have at least three divisions. Football must be big on the isles. No wonder their national team performs above what one would expect from their population size.
Die piek in de zomer is denk ik te verklaren door het feit dat competities dan hun climax naderen. Veel teams moeten winnen om kampioen te worden/Europees te halen/niet te degraderen -> meer risico -> meer goals.
Aan het begin van de competitie, ook in de zomer, wordt meer gescoord omdat teams dan nog wat onwennig zijn -> meer verdedigingsfouten. En de goede spitsen hebben een paar weken vrij gehad en zijn nog niet naar de tering getrapt door de Edwin Olde Riekerinks en Joop Galls van deze wereld.
@6: Deze post is bedoeld voor internationaal publiek (en dat stroom gelukkig nu ook aardig binnen).
Qua score verloop bevat de database inderdaad ook per doelpunt op welk moment die gemaakt is. Maar… die database is vervuild. Veel wedstrijden waar de doelpunten in 1 helft allemaal op minuut 1 of minuut 45 (of 90) staan.
Ben nog aan het uitzoeken of daar op te filteren is zodat dat soort analyses mogelijk zijn.
(ik was bijvoorbeeld op zoek naar Duitsland en scoren in de laatste minuut :-))
Who f*cking cares?
Can I ask how many games are in the complete set, and how many in the smaller 2000-2012 top 2 levels set?
The distributions of scores are extremely close, while the average scores per game is supposed to have declined quite a bit. Also, the average score per game apparently equals 2.77, while almost no year has a lower average, many years have a higher average, and (apart from a few outlier years), only the last few decades the average is consistently close to this number.
Both these observations seem to point to there being many fewer old games in the database, thus making any attempt to draw conclusions on stability of statistics by comparing recent averages to total averages impossible.
As far as their being less goals in the summer in the southern hemisphere, wouldn’t that make sense as the southern hemisphere’s winter is during the summer months of the northern hemisphere?
@1
Tactics indeed. That in combination with growing professionalism (round 1960) and dito tv rights and merchand/advertising from 1980*…
Footballfans.eu, a groundhopping community
Since when became Steeph a Groundhoppert?
What put him over the tresshold to see the light?
* more money = more defense
@2: I’v plotted a new graph using the same data, but this time showing the home to away goals ratio:
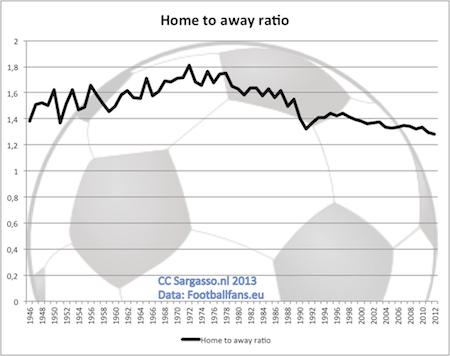
Still the downward trend, albeit slightly less steep.
@11: The complete set is just under a million (975.000). The subset 2000-2012 for the top 2 is 335.000.
The distribution over the years is not even. Years up to the 70’s only contain some 1000 games. Somewhere in the 90’s is shoots 10.000 per year and then in steps to 90.000 per year.
So this means the later, lower average, years put in more weight.
So your conclusion is right. But given the fact that over a 1000 games a year was at least enough to get a usable average, I made a few of those long term charts.
But on other charts that was exactly the reason I choose to limit the period in order to get more significant outcome.
(And I choose not to explain all the details in the post itself because otherwise I would have lost 90% of the readers before the third chart :-) )
Thanks for all these interesting statistics. Especially the decline of home advantage is something I can confirm:
http://clubelo.com/Articles/Themysteriousdeclineofhomeadvantage.html
It is a downward trend, but only since the seventies if you look closely.
@16: Very interesting to see this being supported using a different approach. Thanks for the link. I’ll will spent some time at your side :-)
Liked this article very much (compared to my non existing interest in the game).
Could it be that the difference between the scoring during summer and winter in the northern and southern hemisphere has something to do with the harshness of the winters. Maybe in the southern hemisphere most football is played in countries with rather mild winters?
@18: That was something I thought about as well. And maybe having more and more stadiums with roofs that can close will take away the differences between summer and winter on the Northern hemisphere.
It seems that the probability for home team victory is 43%+ and draw and away team victory lies at about 22% each – does it fit a 2-1-1 or 50%,25%,25% distribution?
@20: I did a count summary on the top 2 level divisions from 2000 to 2012:
Home team victory 48%
Draw 25%
Away team victory 27%
Not exactly 2-1-1, but close.
Dat ziet er wetenschappelijk uit. Grafiekjes maken totdat je een trend ziet.
@spam: Staat er ergens in het artikel “science” of “wetenschap”? Wordt er ergens stellig gesteld dat de heilige graal in voetbaldata is gevonden en de ultieme conclusie getrokken?
Heb je nog wat inhoudelijks te melden of heb je gewoon een slechte dag gehad?
I did a prediction map for West Ham for tehe 2010/2011 season. I looked up their results against the each of the teams in the past 25 games against each team (in all competitions).
I took the results (ignored the score… but probably should have done that), and calculated the perecentage of win/loss/draws both home and away.
I put this into an infographic and wronte about it here -http://www.whfuc.com/west-ham-united-season-2010-2011-predictions/
Pretty sure we got relegated that season… the figures said we should have finished 9th!!!! Stupid statistics ;)
That is a very nice number of goals. I hope in the future there will be score more goals in good games.