DATA - One month ago we showed what the data of one million football (soccer) games tell us. Some people complained that the competitions were not comparable. So here’s an addition to the post with only data from the top divisions of eleven countries.
Two graphs. The first shows the average score per game per year for the last twenty years. You can see that the Dutch competition (Eredivisie) is doing well. The French and Portugese were outliers, but are now catching up.
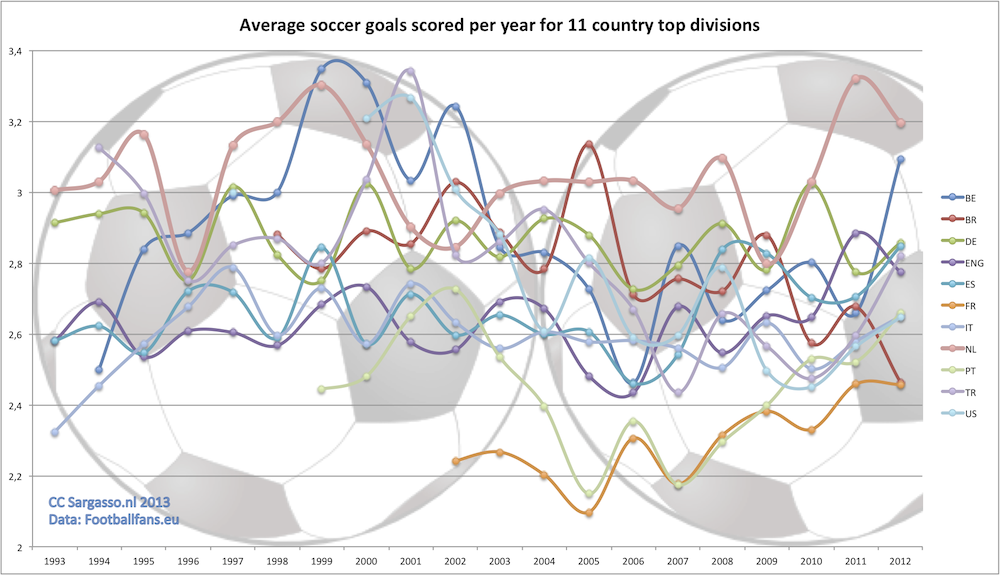
Would have loved to do it per season, but this proved to be a bit too time consuming.
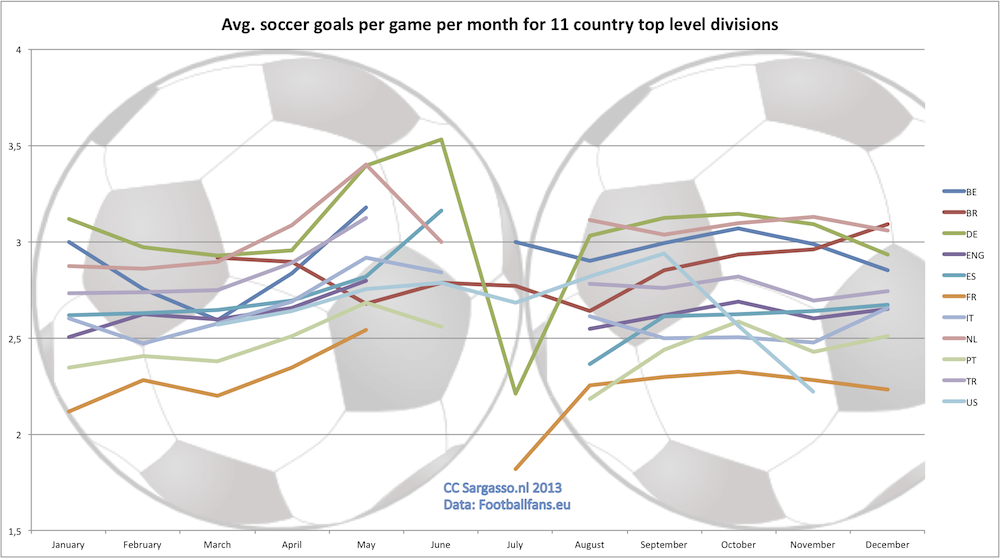
The next graphs are the average scores per game per month of the year. Interesting thing to see, in line with the previous post, is the jump in April/May. This marks the end of most competitions. Check the difference with the Brazilian line.
And for dessert I’ve created a map (thx Esri!) with all the top three best scoring stadiums mentioned in the previous post. Have fun clicking!
(Or use the full screen version)
All data: Footballfans.eu
Competitions:
BE – Belgium – Pro League
BR – Brazil – Serie A
DE – Germany – Bundesliga
ENG – England – Premier League
ES – Spain – Primera División
FR – France – Ligue 1
IT – Italy – Seria A
NL – Netherlands – Eredivisie
PT – Portugal – Portuguese Liga
TR – Turkey – Süper Lig
US – United States – MLS